In geospatial technology world, “mapping” refers to the acquisition of information about where stuff is and storing that information in specialized computer files called spatial databases. A number of approaches to organizing geographic information are in common use. This section of the website focuses on “feature data”, a concept that uses geometric shapes to represent events, objects and conditions on the earth’s surface. The terms “vector data” and “discrete object” are sometimes used to describe feature data.
Feature Data Concepts
GIS newbies encounter feature data very early in the learning process. Intro level course work almost always starts off with feature data examples and exercises. We’ve collected (and in some cases, written) articles intended to help learners get a handle this extremely important approach to organizing spatial data. CHECK IT OUT
Creating and Editing Feature Class Shapes
Bunch of stuff about creating and editing shapes CHECK IT OUT
Creating and Editing Feature Class Attribute Tables
Bunch of stuff about creating and editing tables CHECK IT OUT
Feature Data Stored In XY Data Tables
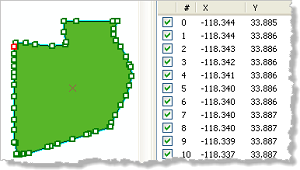
Point data does not have to reside in a feature class file structure to be read by GIS software. Picture a neatly structured table built in Excel, dBase, Microsoft Access or some similar tool. Each row in the table contains attribute values describing an event, object or condition occurring at a point on the earth’s surface. The table includes a Y attribute whose value is the point’s geographic coordinate system latitude or projected coordinate system northing. The table includes an X attribute whose value is the point’s geographic coordinate system longitude or projected coordinate system easting. Spatial data structured in this way is not nearly as useful as a bona fide feature class, but it can be displayed in the ArcMap data frame. We’ve collected (and in some cases, written) articles intended to help learners get a handle this extremely important approach to organizing spatial data. CHECK IT OUT
Items Below The Line Are Under Construction – Return to Top of Page
Representing the real world as data This article from Esri’s ArcGIS Resource Center includes a section titled
The discrete-object view of the world which does an okay job of explaining the vector data model.
CHECK IT OUTThis Otter Geospatial RefDocs article is our response to conflicting advice out there, especially around the 10-character limit on field name length. We use the most restrictive approach to field naming.
CHECK IT OUTThe most effective way to map some kinds of objects, events and conditions is by representing each one by a single dimensionless point. This Otter Geospatial RefDocs article describes how point geometry is used and provides an example.
CHECK IT OUTThe most effective way to map some kinds of objects, events and conditions is by dividing individual items into subsets and representing each subset with a group of dimensionless points (multipoints). This Otter Geospatial RefDocs article describes how multipoint geometry is used and provides an example.
CHECK IT OUTThe most effective way to map some kinds of objects, events or conditions is by representing each item as a single continuous line. This Otter Geospatial RefDocs article describes how singlepart line features are used and provides an example.
CHECK IT OUTThe most effective way to map some kinds of objects, events and conditions is by sorting the individual items into subsets and representing each subset with a discontinuous line.
CHECK IT OUTThe most informative way to map some kinds of objects, events or conditions is by representing each item as a single polygon. This Otter Geospatial RefDocs article describes how singlepart polygon features are used and provides an example.
CHECK IT OUTThe most informative way to map some collections of objects, events or conditions is by representing individual items as polygons. This Otter Geospatial RefDocs article describes how polygon features are represented..
CHECK IT OUTThis Otter Geospatial RefDocs article is our response to conflicting advice out there, especially around the 10-character limit on field name length. We use the most restrictive approach to field naming.
CHECK IT OUTStarting with ArcGIS version 10.0, the
editing interface in ArcMap defaults to a scheme that prompts users
to create templates for each feature class being mapped. The
templates are then used to speed up data entry. This is a
significant change from earlier versions. We are not sold on the
template approach to all feature editing work. This Otter Geospatial RefDocs article describes the procedure to toggle between the ArcGIS 9.x and 10.x editing interfaces which we do regularly depending on the demands of the task at hand.
CHECK IT OUTThis demo project is way too small and simple to justify the elaborate approach we used. By putting in the precautionary steps that would normally be used on a larger project, we’re hoping to get some important points across while holding down the total size of the demo.
CHECK IT OUT